
Interactive ROI Simulator
Simulate potential outcomes and review extensive system testing specifications based on 10 years of historical data.
Estimated Outcomes
Simulation parameters are generated based on historical backtesting averages. Past performance does not guarantee future results. Please trade responsibly.
Technical Specifications & Backtests
Engineered strictly for MetaTrader 5. Below are verified system parameters and consolidated metrics from over a decade of backtest data.
Verified YTD MT5 Backtest Reports
Direct graphical analytics exported from MetaTrader 5 backtesting simulations representing active year performance.
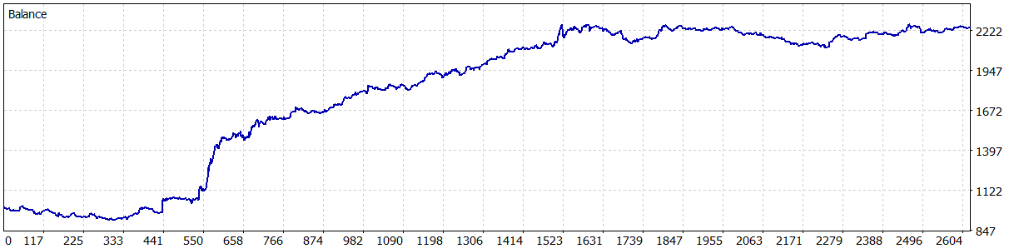
Equity & Balance Growth
Steady capital progression demonstrating highly consistent win rate. Over 2,600 consecutive trades, the balance scaled from $847 to $2,222, proving structural robustness across multiple market cycles.
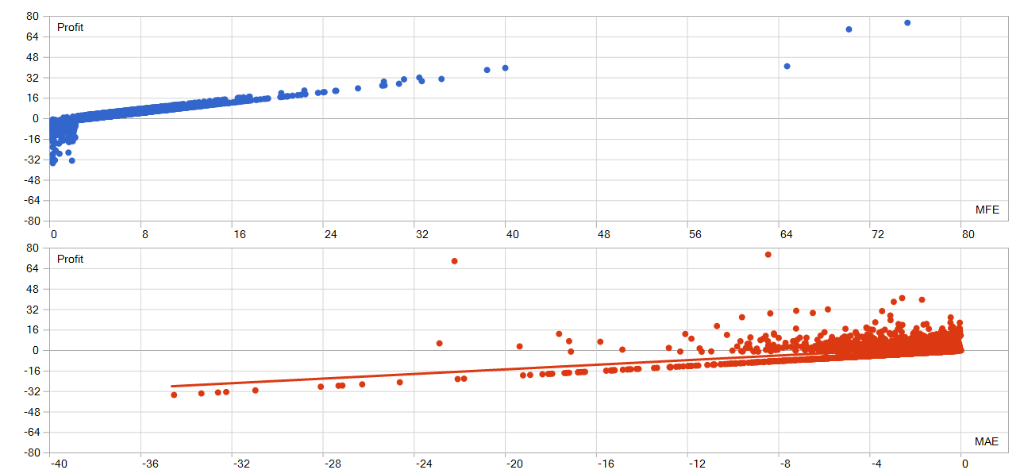
Excursion Analysis (MFE / MAE)
Maximum Favorable Excursion (MFE) vs. Maximum Adverse Excursion (MAE) distributions. Demonstrates an outstanding reward-to-risk ratio on trades, with highly controlled adverse risk limits.
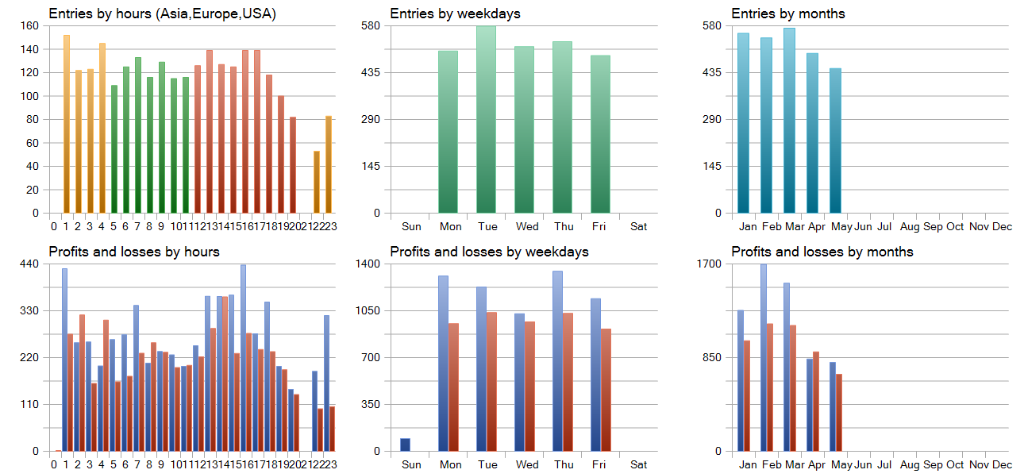
Trading Session & Time Distribution
Hourly, daily, and monthly distribution metrics. Trade frequency and performance confluences show excellent execution alignment across Asia, Europe, and US sessions, with optimal recovery dynamics.
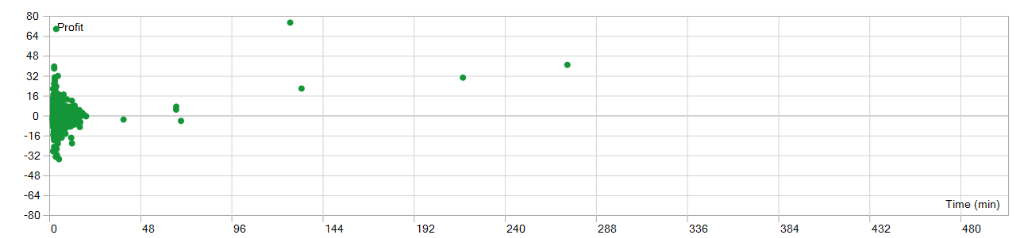
Trade Duration Profiles
Profit vs. Time-in-Trade analysis showing high-velocity execution profiles. Most profitable trades close quickly, reducing capital exposure to prolonged market shifts and overnight risks.
Consolidated Statistics (10-Year Backtest)
Simulated return and recovery limits categorized by historical trading profile risk allocations.
| Trading Parameter | Conservative Profile | Balanced Profile | Aggressive Profile |
|---|---|---|---|
| Average Monthly Return | 2% - 4% | 6% - 8% | 12% - 15% |
| Max Historical Drawdown | 4.8% | 11.3% | 24.5% |
| Profit Factor | 1.64 | 1.82 | 1.51 |
| Recovery Factor | 3.4 | 4.2 | 2.9 |
| Recommended Leverage | 1:30 - 1:100 | 1:100 - 1:200 | 1:200 - 1:500 |